TL;DR
All code related this article has been added to the OpenAPI series repo, open-tf-example.
Read the description in the last chapter how to run it and view the results in CloudWatch logs.
Thanks for reading!
Topic break-down
- TL;DR
- Topic break-down
- How to do logging on AWS Serverless
- Infrastructure code
- Runtime code
- Log aggregator and Search
- What’s next
- Further reading
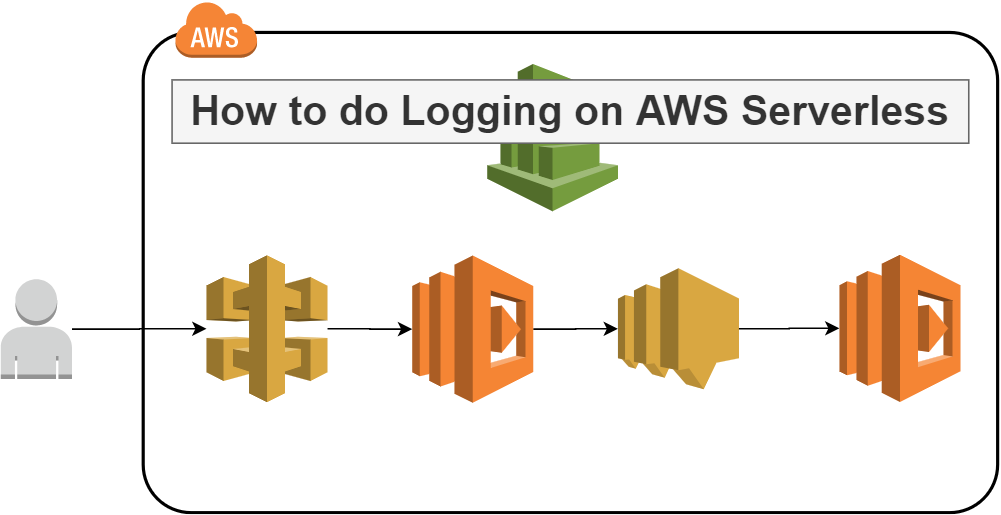
How to do logging on AWS Serverless
In my opinion logging on AWS Serverless can be broken up into 4 area’s:
- Infrastructure code, here we need to setup the services that support any logging activities. Such as;
- AWS CloudWatch log groups for AWS Lambda; Sets up the appropriate groups and the log retention period to ensure cost reduction.
- OpenAPI specification We need to be able to forward debug and logging information into headers. We can model this as Header parameters. This way there’s no guess work in the development team.
- Runtime code, Logger framework and chosen standards. Basically, how do we log and in what kind of structure do we do that. We should take into account that machines can parse the information.
- Log aggregator, AWS CloudWatch logs is an aggregator we will use for this article, but there are many third party alternatives.
- Log search, something breaks (it always does), how do you find out where its broken and how it broke? We need to be able to relate logging information across several services on AWS.
Before we get into each of these area’s, a couple of basic ground rules for logging you should apply:
- Use JSON for each of your log outputs to make them searchable by for instance CloudWatch Logs Insights.
- Standardize the formatting, like this for example:
{
    "message": "Sns message received",
    "level": "info",
    "service": "dev-example-user_receiver",
    "operationName": "",
    "version": "$LATEST",
    "claims": "No Authorization Required",
    "source": "",
    "x_correlation_id": "12345",
    "timestamp": "2020-02-09 13:37:22"
}
- Use a logging framework that standardizes the output, but can also easily send your logs to other outputs streams such as S3, Kinesis, ElasticSearch etc
- Winston for Node/Javascript is a good library that supports multiple output streams (i.e. ‘Transports’).
- Automate the relevant “meta-data” fields as much as possible.
- E.g. for Authenticated API calls we probably want to know who has authenticated, and where the call originated from (IP Address).
- Anonymize your logs, we don’t want to see credit card information in the log files or email addresses.
- GDPR requires that every bit of personal information should be removable, we can start to make sure the logs are clean to begin with.
- Wrap your vendor library for your projects use.
- You can customize the logging and you can swap libraries in and out without having to rewrite all your log statements.
Infrastructure code
To start off with on the infrastructure side, we need to enable several things, first for AWS Lambda. Then for API Gateway, enabling the logging and API specific header settings.
Lambda logs configuration
Make sure you set a retention period on the logs, without this setting you’ll accumulate a lot of data and it can get expensive quick.
Do the following for each of your lambda functions:
variable "log_retention_in_days" {
  description = "How many days should logs be kept in CloudWatch"
  type        = number
  default     = 30
}

resource "aws_cloudwatch_log_group" "_" {
  name              = "/aws/lambda/${local.function_name}"
  retention_in_days = var.log_retention_in_days
}
API Gateway
Next to enabling detailed CloudWatch metrics (see last weeks article), we can also specifically set the logging level for this deployed stage, there are 3 settings; “OFF”, “INFO”, and “ERROR”. Id recommend setting this to ERROR in the dev.tfvars general deployment settings:
api_throttling_rate_limit  = 5
api_throttling_burst_limit = 10
api_metrics_enabled        = true
api_logging_level          = "ERROR"
and then in the actually settings resource, we apply it for the stage dev:
resource "aws_api_gateway_method_settings" "_" {
  rest_api_id = aws_api_gateway_rest_api._.id
  stage_name  = aws_api_gateway_stage._.stage_name
  method_path = "*/*"

  settings {
    throttling_burst_limit = var.api_throttling_burst_limit
    throttling_rate_limit  = var.api_throttling_rate_limit
    metrics_enabled        = var.api_metrics_enabled
    logging_level          = var.api_logging_level
  }
}
OpenAPI integration
Now on to the actual API implementation.
Correlation ID
A correlation Id will make sure we can trace all our logging (and thus execution) across the Serverless chain. If A calls B and then C, we can see all related logging by querying on the correlation Id. More on this in the last chapter how to query with AWS CloudWatch Logs Insights.
To make sure every developer on your team actually uses the correlation Id header when calling your API. Add it to the OpenAPI specification like this:
components:
  parameters:
    correlationIdHeader:
      description: Unique string that can trace execution across services
      in: header
      name: x-correlation-id
      schema:
        type: string
      required: true
Then in our API path we add the parameter reference under parameters;
/user:
  post:
    operationId: postUser
    description: Add a new user
    parameters:
      - $ref: '#/components/parameters/correlationIdHeader'
    requestBody:
      required: true
      content:
        application/json:
          schema:
            $ref: '#/components/schemas/User'
    x-amazon-apigateway-integration:
      uri: "arn:aws:apigateway:${region}:lambda:path/2015-03-31/functions/${lambda_user_arn}/invocations"
      passthroughBehavior: "when_no_match"
      httpMethod: "POST"
      timeoutInMillis: ${lambda_user_timeout}
      type: "aws_proxy"
    responses:
      200:
        $ref: '#/components/responses/lambda'
      400:
        $ref: '#/components/responses/lambda'
      500:
        $ref: '#/components/responses/500APIError'
    tags:
        - User
Debug logging in Production
In a production environment we do not want to capture all our debug logging, it will be very expensive in high load situations, therefore we want to capture only a small percentage of debugging such that we can still act on that information in the case of production errors.
First, we’ll need a debug log level parameter in the API call header of the OpenAPI specification, similarly to the correlation Id, you can specify the debug level header with possible values:
components:
  parameters:
    debugHeader:
      description: Force debug level for this execution run
      in: header
      name: x-debug-level
      schema:
        type: string
        enum: [error, debug, info]
      required: false
Now we can capture any explicitly set debug level and bring that setting across the execution chain of services. But to that, we’d like to automate WHEN it should set the debug level. We can set this in software with the help of the debug sample rate configuration we made as an environment variable. How to do the actual software part, we’ll cover in the next chapter.
In our dev.tfvars we can set the sample rate.
debug_sample_rate = 0.05
This will get applied to an AWS Lambda environment variable after deployment:
module "lambda" {
  source = "../../modules/lambda"

  # Removed several parameters for brevity

  lambda_environment_variables = {
    NAMESPACE = var.namespace
    REGION    = var.region

    COGNITO_USER_POOL_CLIENT_ID = var.cognito_user_pool_client_id
    COGNITO_USER_POOL_ID        = var.cognito_user_pool_id

    DEBUG_SAMPLE_RATE = var.debug_sample_rate

    SNS_TOPIC = module.sns.topic_arn
  }
}
Runtime code
Now we just need to enable the sample rate and make sure we take the correlation Id and apply it to the next integration point.
Debug log level in Production
For that we can use the DEBUG_SAMPLE_RATE environment variable. In our Logging code we want to make sure we capture this setting as follows:
Logger.prototype.setLogLevel = function () {
  const logLevel = this.getLogLevel()

  if (logLevel === undefined) {
    if (process.env.NAMESPACE === 'prod') {
      if (process.env.DEBUG_SAMPLE_RATE > Math.random()) {
        return 'debug'
      } else {
        return 'error' // for Production environment
      }
    } else {
      return 'debug' // for development and test environments
    }
  }
  return logLevel
}
To make sure this carries over across service invocations, we can set the log level explicitly with a header in our API Gateway calls, or via parameters in an SNS, SQS, service invocation for example. That decision can be passed down and set with the debugLevel variable:
Logger.prototype.HTTP_DEBUG_HEADER = 'x-debug-level'

Logger.prototype.getLogLevel = function () {
  if (this.isApiGateway()) return this.event.headers[this.HTTP_DEBUG_HEADER]
  if (this.isSNS()) return this.event.Records[0].Sns.MessageAttributes.x_debug_level.Value

  // add more relevant services here..

  // No debug level set, revert to defaults
  return undefined
}
Correlation Id setting and forwarding
We’ve seen how the correlation Id is set on AWS Api Gateway, we use the header to apply it at API execution time.
In order to forward it for AWS SNS, we have to embed it in the actual message payload. We do not have any headers we can set here.
In the SNS library code, we add a message attribute as follows:
var params = {
    Message: message,
    MessageAttributes: {
      x_correlation_id: {
        DataType: 'String',
        StringValue: correlationId
      }
    },
    TopicArn: topicARN
  }

const results = await sns.publish(params).promise()
To receive and process the correlation Id at the other end, we do the following in the correlationId library:
CorrelationId.prototype.HTTP_CORRELATION_ID_HEADER = 'x-correlation-id'

CorrelationId.prototype.getCorrelationID = function () {
  if (this.isApiGateway()) return this.event.headers[this.HTTP_CORRELATION_ID_HEADER]
  if (this.isSNS()) return this.event.Records[0].Sns.MessageAttributes.x_correlation_id.Value

  // No ID found
  return undefined
}
The AWS Lambda event object, in the case of an SNS integration, will contains a record set which contains the message attribute we set in the SNS library a bit earlier.
Now that all the code pieces fit together, we can deploy this and execute the API to see what happens in our Serverless application.
Log aggregator and Search
Example
If you have deployed the solution as given in my repo. Import the OpenAPI YML file into Postman, the file is located in:
./services/api/example.yml
Make sure to replace the servers url parameter with the api_url Terraform output parameter before you have Postman generate the Test Suite. That way the URL’s are all correct instead of pointing to http://example.com/
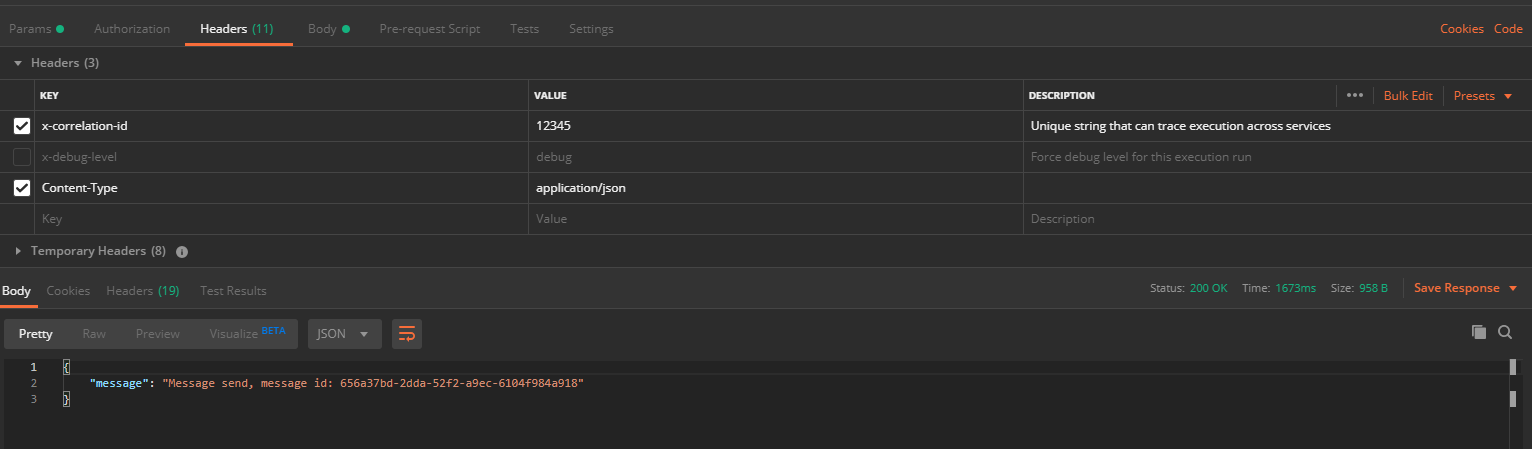
Once generated, go to Collections, the test case you generated, then ‘User’ > ‘post User’ API. In the Headers tab make sure to change the x-correlation-id header into whatever you like. Hit the Send button and follow along.
CloudWatch Logs Insights
In the AWS Console, navigate to CloudWatch and then Insights.
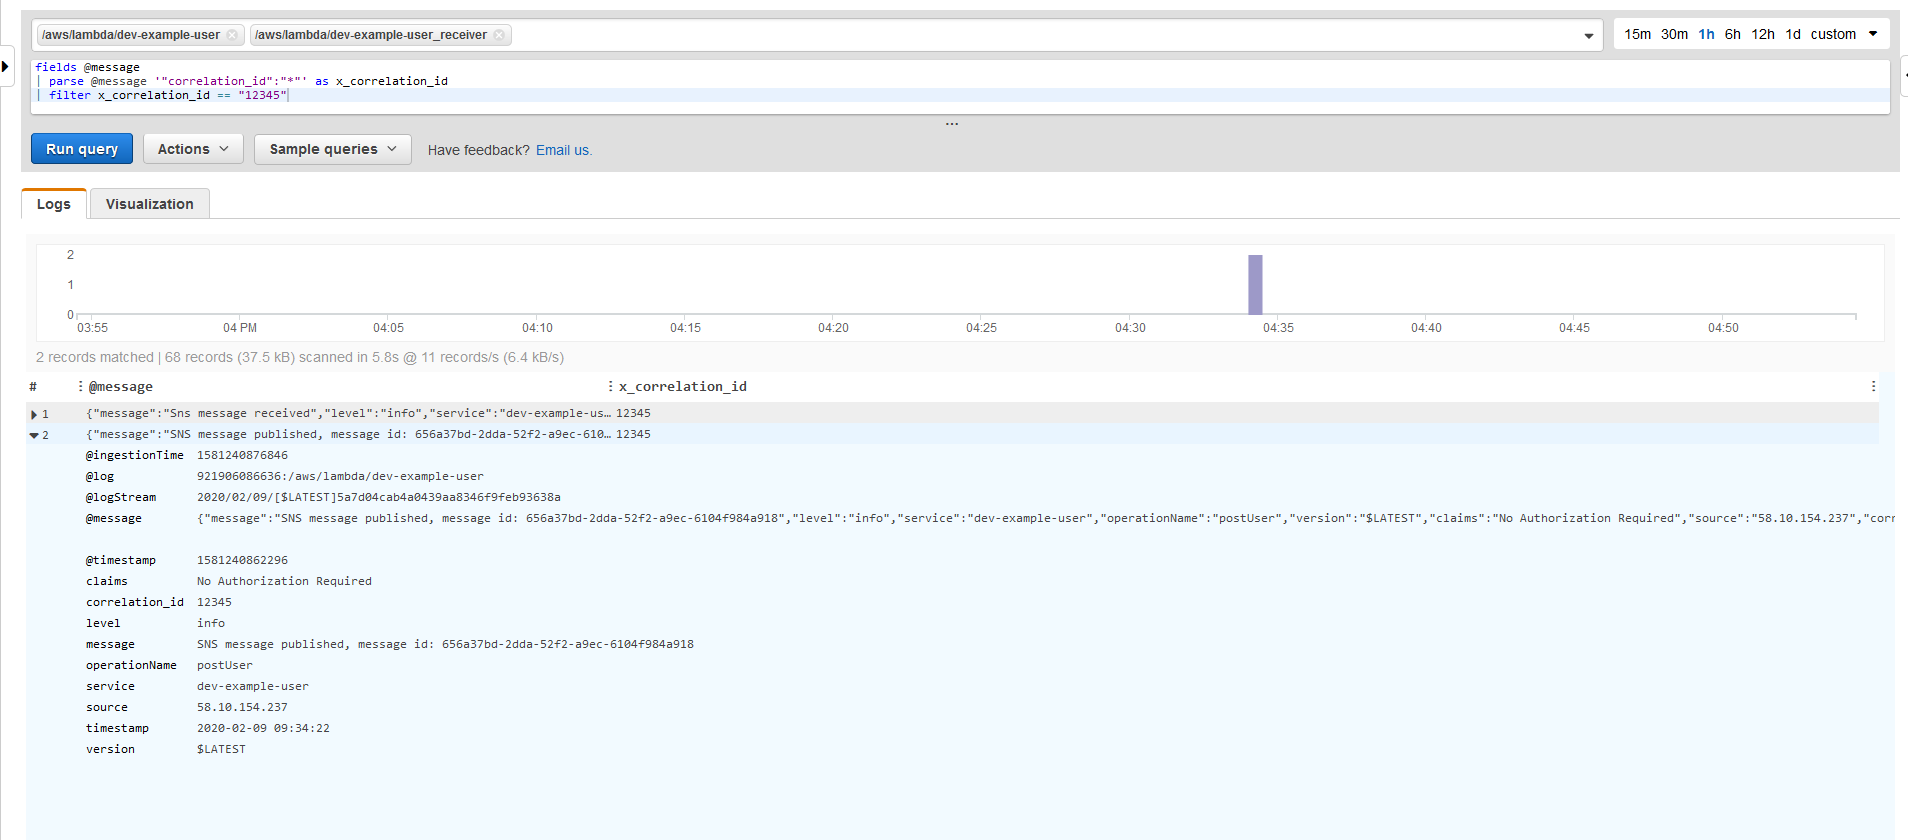
To find the messages generated by the Lambda functions, we can do a match on the correlation Id:
fields @message
| parse @message '"correlation_id":"*"' as x_correlation_id
| filter x_correlation_id == "12345"
Please note that you have to pipe ‘|’ both actions; parse, and filter, for the query to understand how to process this. We can apply this query across multiple log groups, that way we can find all messages related to this specific execution run.
In this case we can see that two lambda’s have been executed; the first as a result of our SNS message call, the second Lambda was called via the initial AWS API Gateway API:
What’s next
With all of this you should be able to;
- create / extend a logging framework that works across your AWS Serverless infrastructure, and runtime code.
- search your log groups effectively with CloudWatch Logs Insights.
Next week I’ll cover how to do tracing across your Serverless landscape with AWS X-Ray, which I didn’t get to this week. So stay tuned for that.
Thanks for reading and till next week!
Further reading
Logging best practices
- https://logz.io/blog/logging-best-practices/
- https://www.loggly.com/blog/30-best-practices-logging-scale/
Node logging Libraries and how-to’s:
- https://blog.risingstack.com/node-js-logging-tutorial/
- https://www.loggly.com/blog/node-js-libraries-make-sophisticated-logging-simpler/
- https://github.com/winstonjs/winston
- https://github.com/lazywithclass/winston-cloudwatch
- https://thisdavej.com/using-winston-a-versatile-logging-library-for-node-js/